The coastal plain of Torrance presents a deceptive calm at the surface. Beneath the manicured lawns of the South Bay, the subsurface transitions rapidly from young alluvial deposits to the deep, folded sediments of the Los Angeles Basin. This geological jigsaw—shaped by the ancient course of the Los Angeles River and the proximity to the Palos Verdes Fault zone—makes standard penetration testing alone insufficient for critical infrastructure. Seismic tomography cuts through the ambiguity. When a recent expansion at the Torrance Refinery required precise bedrock depth mapping across a 15-acre site, the variation in weathered schist contact ranged from 15 to over 80 feet within a hundred-yard span. That kind of lateral heterogeneity, typical in zones bounded by the Palos Verdes and Newport-Inglewood fault systems, is why we integrate refraction and reflection tomography early in the geotechnical sequence. The velocity models derived from these surveys feed directly into Site Class determinations under ASCE 7-22, replacing interpolation with measured data. For deep foundations or slope stability assessments near the bluffs of Palos Verdes, knowing the true geometry of the subsurface is non-negotiable.
In Torrance, a seismic velocity model is worth more than a hundred borings when the bedrock surface jumps 60 feet in less than a city block.
Service characteristics in Torrance
Local geotechnical conditions in Torrance
A seven-story mixed-use project on Crenshaw Boulevard hit a wall during excavation when the contractor discovered a paleochannel filled with soft organic silt that none of the preliminary borings had crossed. The excavation shoring design—based on a homogeneous soil profile from five CPT soundings—was suddenly inadequate for a 20-foot-deep lens of compressible material with a shear-wave velocity below 500 ft/s. The delay cost the developer six weeks while a supplemental seismic refraction survey mapped the channel’s lateral extent, which turned out to be 140 feet wide and aligned with a buried stream channel from the late Holocene. Had the tomography data been collected during the initial site characterization, the shoring engineer would have spotted the velocity anomaly on the P-wave tomogram and designed the soldier pile embedment accordingly. Torrance’s building department, referencing Section 1803 of the IBC and the city’s local amendments, increasingly expects geophysical cross sections when the site is within 1,000 feet of a mapped fault trace or when the proposed structure exceeds four stories. Skipping the tomography in these conditions is not a risk—it is a gamble with the schedule and the foundation budget.
Our services
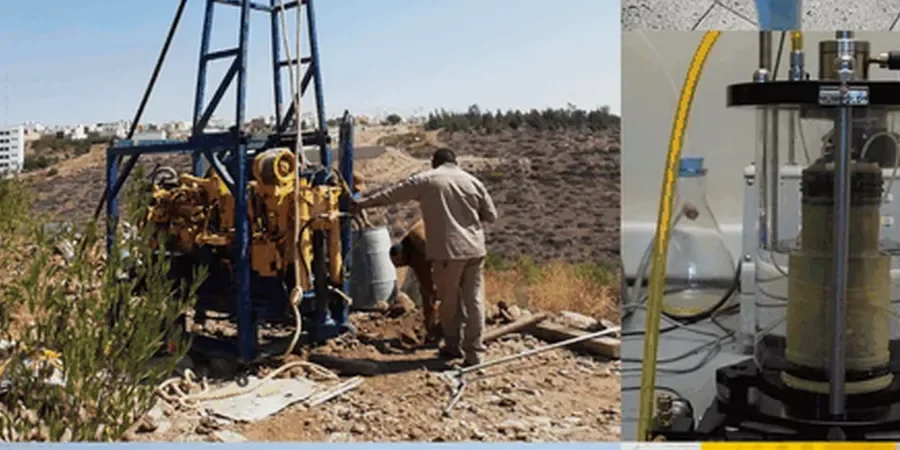
The seismic tomography services we coordinate in Torrance cover the full spectrum of near-surface geophysical investigation. Every survey is designed around the specific depth target and site constraints—urban noise, overhead power lines, or limited access along narrow right-of-ways all influence the acquisition geometry.
P-Wave Refraction Tomography
Rapid mapping of compressional velocity structure to depths of 100–120 feet. Ideal for bedrock profiling, rippability assessment, and delineating buried channel deposits across large Torrance industrial parcels.
SH-Wave Reflection Profiling
High-resolution shear-wave reflection surveys that image stratigraphic boundaries below the water table where P-wave refraction fails. Used extensively for fault trace mapping near the Palos Verdes fault zone and for deep basin geometry.
Downhole and Crosshole Seismic Testing
Borehole-based velocity measurements that tie directly to CPT and SPT data. Provides the Vs profiles needed for Site Class A through E determination per ASCE 7, calibrated with the surface tomography grid.
Surface Wave Analysis (MASW)
When 1D shear-wave velocity profiles are needed across a tight grid, MASW complements refraction tomography. We process the same shot gathers to extract Rayleigh wave dispersion curves and invert them for Vs versus depth in 5-foot intervals.
Common questions
How much does a seismic refraction survey cost for a typical Torrance residential lot?
A single-line refraction survey on a standard 50 x 150 foot residential lot in Torrance, targeting bedrock depth to 60 feet with a 24-channel array, runs between US$2,520 and US$5,480. The spread depends on array length, number of shot points, and whether we need to combine refraction with a reflection line for deeper imaging. Sites with heavy traffic noise along Hawthorne Boulevard or near the refinery may require night acquisition or a larger source, which pushes the cost toward the higher end of the range.
What depth can seismic tomography realistically reach in the Los Angeles Basin?
Refraction tomography with a weight-drop source and a 240-foot spread routinely images to 100–120 feet in Torrance’s alluvial soils. Reflection surveys, particularly SH-wave profiles, can map structure well past 700 feet when we use a longer spread and a higher-energy source like a Betsy gun. The practical limit in an urban setting like Torrance is usually not the energy but the space—we need 300 to 500 feet of clear line for a deep reflection profile, which is tight on a city lot but feasible on larger commercial parcels.
Does seismic refraction work if the bedrock velocity is lower than the overlying soil?
No—a classic refraction survey cannot resolve a velocity inversion, where a softer layer sits beneath a stiffer one. That scenario occurs in Torrance when a dense caliche layer overlies a weathered, saturated Fernando shale with lower P-wave velocity. In these cases we switch to reflection profiling or MASW, which do not rely on a monotonic velocity increase. The decision tree we follow for every Torrance site includes a desk review of nearby borehole data to flag potential inversions before committing to a method.